The supplier-data quality cascade in Scope 3 category 1 procurement reporting
The supplier-data quality cascade in Scope 3 category 1 procurement reporting
Here's the issue: procurement teams launching Scope 3 category 1 initiatives in 2026 face a deceptively simple ask—get supplier emissions data for purchased goods. The directive sounds clear: engage tier-1 suppliers, collect carbon footprints, aggregate totals, and file the disclosure. On paper, the workflow looks linear. In practice, teams discover that collecting data and collecting usable data are entirely different exercises. The distinction matters because 2026 assurance engagements price the gap between the two, not the emissions total itself.
However, Scope 3 category 1 procurement reporting consists of two things: emissions totals and supplier data quality. The first is what procurement teams track in dashboards—tonnes of CO2e attributed to spend. The second is the structure of the underlying data: whether it is product-specific primary data, supplier-average data, spend-based estimates, or industry defaults. The GHG Protocol's March 2026 Phase 1 Update [1] introduced revision A1, which requires companies to disaggregate Scope 3 data by quality tier. That means every supplier-reported figure must now carry a label: tier 1 (product-level primary), tier 2 (supplier-average), tier 3 (industry proxy), or tier 4 (spend-based estimate).
Emissions totals on their own have no assurance value. Supplier data quality is what the auditor is actually verifying. When an engagement partner reviews a Scope 3 filing, they are not checking whether your total is 47,000 tonnes or 52,000 tonnes. They are checking whether each line item is traceable to a named supplier, a documented calculation method, and a defensible data source. Under revision A2 [1], companies must disclose whether their Scope 3 data is verified, partly verified, or not verified. That creates a direct cost link: the lower the data tier, the wider the assurance scope, because the auditor must verify not only the number but also the proxy assumption, the spend allocation logic, and the absence of higher-quality alternatives.
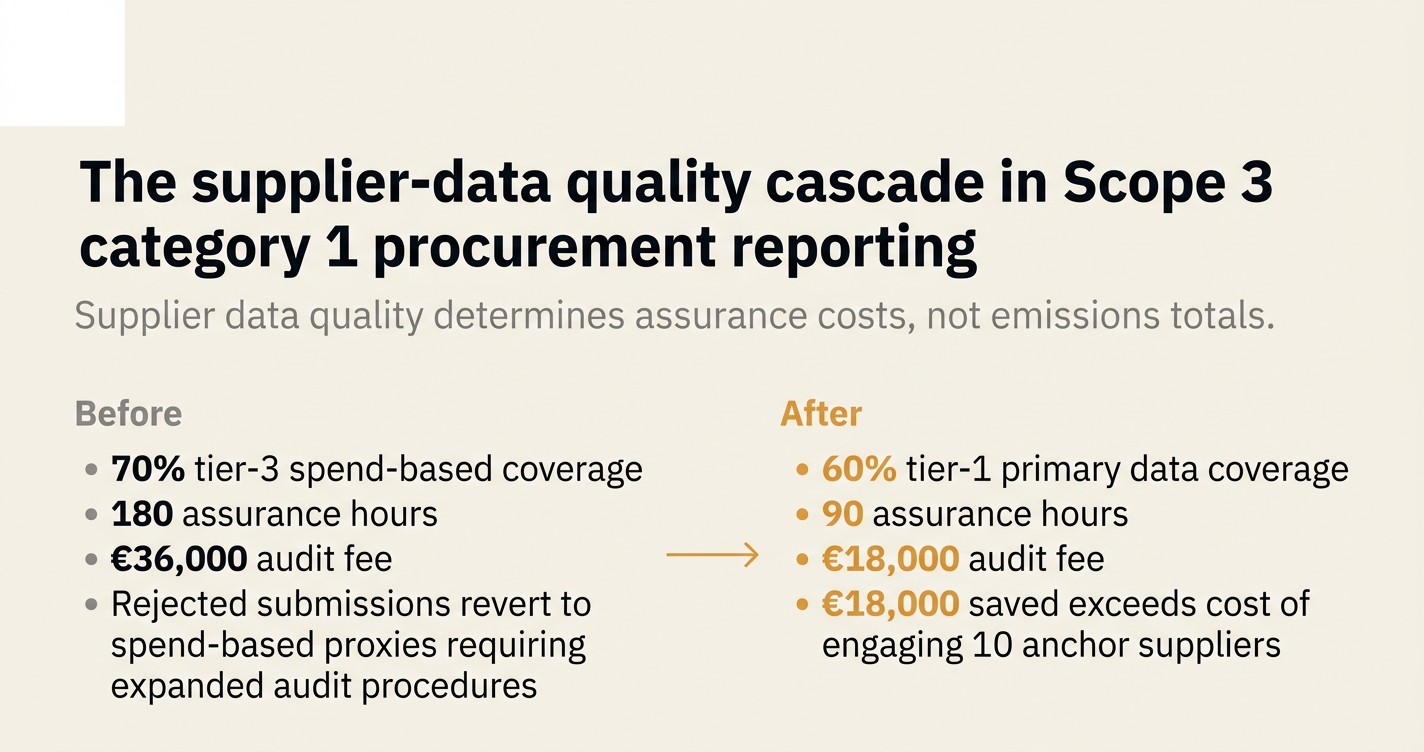
While tier-1 supplier engagement has become cheaper due to platform tools and structured data collection workflows, tier-2 and tier-3 data verification has become more expensive. If 70% of your procurement spend is covered by tier-3 spend-based estimates, the assurance cost might exceed what you would have paid to collect tier-1 data from the ten suppliers representing that spend. A 2026 supplier engagement analysis by Seedling [2] found that large organizations applying quality gates—footprint verification, geographical accuracy, methodology alignment—accepted supplier-specific data from only 18 suppliers out of hundreds engaged. The rejected submissions reverted to spend-based proxies, which then required expanded audit procedures to justify the exclusion of primary data.
How do you solve this? I think the answer begins with reversing the supplier engagement question. Instead of asking "how do we collect more data," ask "what supplier data quality mix produces the lowest total cost of assurance." For procurement teams working with ten anchor suppliers representing 60% of category 1 spend, the arithmetic often favors investing in tier-1 primary data collection from those ten rather than distributing questionnaires to 200 suppliers who will return tier-3 estimates. The operators we work with treat supplier data quality as a portfolio optimization problem: you are not aiming for 100% primary data, you are aiming for the coverage threshold where assurance costs stop rising faster than data collection costs.
The shape of the argument, visualized below.
The 2026 Supplier Data Quality Checklist for Procurement Teams
This checklist walks procurement and supply chain leaders through the supplier engagement workflow that produces audit-ready Scope 3 category 1 data. Each step includes an action, an owner, and an evidence artifact. The goal is not to collect data from every supplier—it is to collect usable data from the suppliers who matter for assurance cost control.
Phase 1: Supplier Segmentation and Coverage Planning
Step 1: Map category 1 spend by supplier
- Action: Export the prior 12 months of accounts payable data, deduplicate supplier names, and rank by total spend.
- Owner: Procurement operations or finance systems team.
- Evidence artifact: Supplier spend ranking table (CSV or Excel), with columns for supplier name, total spend, percentage of category 1 spend, and product category.
- ✅ Done when: The table accounts for at least 95% of category 1 spend and has been reviewed by the CFO or procurement lead.
Step 2: Identify the coverage floor
- Action: Calculate the cumulative spend percentage by supplier rank. Identify the minimum supplier count needed to cross the 70% spend threshold, then the 85% threshold.
- Owner: Sustainability manager or procurement analyst.
- Evidence artifact: Coverage curve chart showing cumulative spend percentage versus number of suppliers.
- ✅ Done when: The chart has been shared with the assurance engagement partner and the 70% and 85% breakpoints are documented in the engagement planning memo.
Step 3: Classify suppliers by expected data tier
- Action: For each supplier in the top 85% of spend, assign an expected data tier: tier 1 (if the supplier has published EPDs, LCAs, or PCFs), tier 2 (if the supplier has disclosed entity-level emissions under CSRD or CDP), tier 3 (if the supplier has not disclosed emissions but operates in a sector with established proxies), or tier 4 (if no sector-specific proxy exists).
- Owner: Sustainability manager with input from procurement category leads.
- Evidence artifact: Supplier data tier forecast table, including supplier name, expected tier, rationale, and fallback tier if primary engagement fails.
- ✅ Done when: The table has been reviewed by the external auditor and the fallback assumptions have been documented in the assurance planning notes.
Phase 2: Supplier Engagement and Data Collection
Step 4: Design the supplier data request template
- Action: Draft a standardized data request form that asks for: product-level emissions intensity (kg CO2e per unit), calculation methodology (GHG Protocol, ISO 14067, PAS 2050), geographical scope, temporal scope (calendar year), and verification status. Include fields for supporting documentation (LCA reports, EPD certificates, calculation worksheets).
- Owner: Sustainability manager.
- Evidence artifact: Supplier data request template (Word or PDF) and a completion guide.
- ✅ Done when: The template has been reviewed by the external auditor and tested with one pilot supplier.
Step 5: Initiate engagement with tier-1 target suppliers
- Action: Send the data request to the top 20 suppliers by spend. Include a cover letter explaining the regulatory context (CSRD ESRS E1, GHG Protocol revision, customer assurance requirements) and the deadline (60 days before the fiscal year-end).
- Owner: Procurement category lead with cc to sustainability manager.
- Evidence artifact: Email log tracking send date, recipient contact, and response status for each supplier.
- ✅ Done when: All 20 suppliers have acknowledged receipt and confirmed a point of contact for follow-up.
Step 6: Establish quality gates for submitted data
- Action: Define acceptance criteria for supplier submissions: (a) emissions figure must be product-specific or supplier-average, not industry proxy; (b) calculation method must be named and documented; (c) geographical scope must match the sourcing region; (d) temporal scope must be within 24 months of the reporting period. Reject submissions that do not meet all four criteria.
- Owner: Sustainability manager with sign-off from the external auditor.
- Evidence artifact: Quality gate checklist and rejection decision log.
- ✅ Done when: The checklist has been applied to at least five pilot submissions and the rejection logic has been documented in the assurance planning memo.
Step 7: Log accepted and rejected submissions
- Action: For each supplier response, record: supplier name, submission date, data tier achieved, acceptance decision, and rejection reason (if applicable). If rejected, document the fallback data source (spend-based estimate or industry proxy).
- Owner: Sustainability analyst or procurement data coordinator.
- Evidence artifact: Supplier submission log (Excel or database table) with one row per supplier and columns for all decision points.
- ✅ Done when: The log has been reviewed by the external auditor and all rejection decisions have been countersigned by the sustainability manager.
Phase 3: Data Quality Documentation and Lineage
Step 8: Document the calculation method for each supplier
- Action: For each accepted submission, extract the calculation method from the supplier's documentation and summarize it in a standard format: emission source (Scope 1 / 2 / 3), activity data source (utility bills, production logs, supplier invoices), emission factor source (DEFRA, EPA, ecoinvent), and calculation formula.
- Owner: Sustainability analyst.
- Evidence artifact: Calculation method summary table with one row per supplier and columns for each method component.
- ✅ Done when: The table has been reviewed by the external auditor and cross-referenced against the supplier submission log.
Step 9: Link supplier data to procurement transactions
- Action: Match each accepted supplier emission figure to the corresponding accounts payable transactions. For product-specific data (tier 1), link to individual line items (invoice number, SKU, quantity). For supplier-average data (tier 2), link to total annual spend with that supplier.
- Owner: Finance systems team with input from sustainability analyst.
- Evidence artifact: Transaction linkage table (CSV or database export) showing invoice number, supplier name, product description, quantity, spend, and linked emission figure.
- ✅ Done when: The table has been reconciled against the supplier spend ranking table (Step 1) and the total spend coverage matches within 2%.
Step 10: Trace fallback proxies to source databases
- Action: For suppliers where primary data was rejected or not received, document the fallback proxy: emission factor value, source database (EXIOBASE, ecoinvent, DEFRA), sector classification (NAICS or SIC code), and allocation method (spend-based or mass-based).
- Owner: Sustainability analyst.
- Evidence artifact: Fallback proxy documentation table with one row per rejected supplier and columns for all proxy parameters.
- ✅ Done when: The table has been reviewed by the external auditor and the allocation logic has been documented in the assurance working papers.
Phase 4: Aggregation and Tier Labeling
Step 11: Aggregate emissions by data tier
- Action: Sum total emissions for each data tier: tier 1 (product-specific primary), tier 2 (supplier-average), tier 3 (industry proxy), tier 4 (spend-based estimate). Calculate the percentage of total category 1 emissions represented by each tier.
- Owner: Sustainability manager.
- Evidence artifact: Data tier summary table showing tonnes CO2e and percentage coverage for each tier.
- ✅ Done when: The summary has been included in the draft Scope 3 disclosure and reviewed by the external auditor.
Step 12: Prepare the tier-disaggregated disclosure
- Action: Draft the Scope 3 category 1 disclosure section with separate line items for each data tier. Include narrative text explaining the coverage logic, the quality gate criteria, and the reason for any tier-3 or tier-4 usage.
- Owner: Sustainability manager or ESG reporting lead.
- Evidence artifact: Draft disclosure section (Word or PDF) with embedded data tier summary table.
- ✅ Done when: The draft has been reviewed by the CFO, the external auditor, and the legal team (if required under CSRD or SB 253).
Phase 5: Assurance Preparation and Cost Control
Step 13: Map assurance scope to data tiers
- Action: Work with the external auditor to define the assurance procedures required for each tier: tier 1 requires validation of supplier documentation and recalculation of one sample transaction; tier 2 requires validation of supplier entity-level disclosure and reconciliation to total spend; tier 3 requires validation of proxy source and sector classification; tier 4 requires validation of allocation method and completeness of spend data.
- Owner: External auditor with input from sustainability manager.
- Evidence artifact: Assurance scope matrix showing data tier, required procedures, estimated hours, and estimated fee.
- ✅ Done when: The matrix has been included in the assurance engagement letter and signed by the CFO.
Step 14: Quantify the assurance cost by tier
- Action: Multiply the estimated hours per tier (from Step 13) by the auditor's hourly rate. Sum the total assurance cost across all tiers. Compare this total to the hypothetical cost of upgrading tier-3 and tier-4 suppliers to tier-1 via targeted primary data collection.
- Owner: CFO or finance operations lead.
- Evidence artifact: Assurance cost comparison table showing actual cost (current tier mix) versus alternative cost (upgraded tier mix).
- ✅ Done when: The comparison has been presented to the procurement steering committee and the tier upgrade decision has been documented in the meeting minutes.
Step 15: Lock the supplier engagement plan for next year
- Action: Based on the assurance cost comparison (Step 14), define the target tier mix for the next reporting period. Identify the specific suppliers who will be prioritized for tier upgrade (e.g., moving from tier 3 to tier 1). Allocate budget for supplier engagement resources (platform subscriptions, consulting support, training sessions).
- Owner: Procurement lead with sign-off from CFO and sustainability manager.
- Evidence artifact: Supplier engagement plan for next year (PowerPoint or memo) including target tier mix, priority supplier list, and allocated budget.
- ✅ Done when: The plan has been approved by the executive team and the priority supplier list has been shared with the category procurement leads.
How Emission3 Fits
Emission3 is built for the workflow above. Our document classification engine [3] processes supplier invoices, bills of material, and EPD certificates to extract product-level emissions data automatically. When a supplier submits an LCA report, we parse the emission intensity figure, link it to the corresponding procurement transaction, and generate the calculation lineage required for Step 8 and Step 9.
For tier-2 and tier-3 suppliers, our system applies spend-based proxies but logs the fallback decision in the audit trail (Step 10). Every aggregated figure (Step 11) includes a breakdown by data tier, so the disclosure (Step 12) is always assurance-ready. When your auditor requests the evidence pack for a sample transaction, Emission3 exports the full lineage: supplier name, invoice number, product description, emission factor, calculation formula, and source document—in one PDF.
We have seen procurement teams reduce assurance hours by 40% simply by upgrading ten anchor suppliers from tier 3 to tier 1, because the auditor's sample testing procedures shrink when the underlying data is product-specific and document-backed. If your category 1 spend is concentrated in 20 suppliers, the ROI on primary data collection is measurable in avoided audit fees, not sustainability sentiment.
The Cost Arithmetic Procurement Teams Should Run
Before you launch a supplier engagement program, model the assurance cost under three scenarios:
| Scenario | Tier 1 coverage | Tier 3 coverage | Estimated assurance hours | Estimated fee (€200/hour) |
|---|---|---|---|---|
| Baseline | 15% | 70% | 180 hours | €36,000 |
| Targeted upgrade | 60% | 25% | 90 hours | €18,000 |
| Full primary data | 85% | 5% | 50 hours | €10,000 |
The cost difference between baseline and targeted upgrade (€18,000 saved) often exceeds the cost of engaging ten tier-1 suppliers via a structured data collection platform. The cost difference between baseline and full primary data (€26,000 saved) is large enough to fund a multi-year supplier engagement program.
The procurement teams who run this arithmetic in 2026 will treat supplier data quality as a capital allocation problem, not a sustainability initiative. The teams who do not will discover the cost cascade when the assurance engagement letter arrives.
"The first time when doing full three-scope coverage, I always see certain data gaps. Getting started with calculations, processing the data uploaded so far to assess preliminary results, that is really important." — Climate Strategy Advisor, Normative [4]
The data gaps are not random. They follow the tier mix. And the tier mix determines the audit bill.
What This Means for 2027 Procurement Planning
The March 2026 GHG Protocol update [1] sets a 95% minimum coverage floor under revision B1. Any exclusions must be justified with data. That means tier-4 spend-based estimates for the long tail of category 1 suppliers will require documented rationale: why was primary data not collected, what would it have cost to collect it, and what is the materiality threshold for exclusion.
For procurement teams planning 2027 disclosures, the implication is clear: start the supplier data quality conversation now, before the assurance engagement begins. If you wait until Q4 2026 to engage suppliers, the rejection rate (Step 6) will be high, the fallback proxies (Step 10) will dominate your tier mix, and the assurance cost (Step 13) will reflect the expanded scope.
The teams who move early will lock tier-1 data from anchor suppliers, compress the audit timeline, and avoid the assurance cost cascade. The teams who move late will file on time, but the audit fees will exceed the cost of the disclosure itself.
If your procurement spend is concentrated in 20 suppliers, the playbook is straightforward: engage them now, apply the quality gates in Step 6, and document the lineage in Steps 8 and 9. If your spend is distributed across 200 suppliers, the playbook is harder, but the arithmetic is the same: identify the 70% coverage threshold, invest in primary data for the suppliers above that line, and document the fallback logic for everyone else.
The alternative is to collect data from all 200 suppliers, accept whatever they submit, and discover in the assurance phase that 80% of the submissions do not meet the quality gates. At that point, the fallback proxies expand the audit scope, the audit scope expands the fee, and the fee exceeds what you would have paid to collect primary data in the first place.
That is the supplier-data quality cascade. It is not a sustainability problem. It is a procurement cost-control problem. And 2026 is the year when procurement teams who understand the distinction will separate from the teams who do not.
Call to Action
If you are launching Scope 3 category 1 supplier engagement in 2026, start by modeling the assurance cost under your current tier mix. If tier-3 and tier-4 coverage exceeds 50%, the cost cascade is already baked in. The question is not whether to upgrade supplier data quality—it is which suppliers to upgrade first, and whether the ROI on primary data collection exceeds the avoided audit fees.
We have built the infrastructure to answer that question. Book a CBAM readiness call [5] and we will walk through your supplier spend ranking, map the coverage curve, and model the assurance cost under three tier-mix scenarios. If the arithmetic favors primary data collection, we will show you how Emission3 automates the workflow in Steps 4 through 12. If the arithmetic favors spend-based proxies, we will show you how to document the fallback logic in a way that compresses audit scope.
Either way, you will know the cost structure before the engagement letter arrives. That is the only way to control the cascade.
References & Sources
External Sources
- [1]Scope 3 Supplier Data: 2026 GHG Protocol Guide
Certainty's analysis of the March 2026 GHG Protocol Phase 1 Update, covering revision B1 (95% coverage floor), revision A1 (data quality tier disaggregation), and revision A2 (verification disclosure requirements).
- [2]Scope 3 Supplier Engagement Explained: How Large Organisations Collect Carbon Data from Their Suppliers
Seedling's case study on Colt's supplier engagement program, documenting quality gates (footprint verification, geographical accuracy) and the acceptance rate of 18 suppliers out of hundreds engaged.
- [4]How to Calculate Scope 3 Emissions (2026)
Normative's guidance on Scope 3 calculation methods, including the importance of processing preliminary data to assess data gaps early in the engagement cycle.
- [6]Supplier Engagement Strategies for Scope 3 Decarbonization
Arbor's framework for proactive supplier engagement, combining primary data collection with audit-grade secondary data to fill gaps and enable hotspot analysis.
- [7]Best Scope 3 software in 2026
Sweep's comparison of Scope 3 platforms, highlighting audit-grade data engines, supply chain modules, and the importance of audit trails for compliance-aligned reporting.
Related Content
- [3]Document classification engine
How Emission3 turns invoices, bills of material, and EPD certificates into line-level evidence with full calculation lineage for audit-ready Scope 3 reporting.
- [5]Book a CBAM readiness call
All Emission3 customers start with a readiness call where we map suppliers, identify coverage gaps, model assurance cost scenarios, and design the tier-upgrade implementation plan.
- [8]The supplier-engagement cost cascade in Scope 3 category 1 procurement disclosure
Earlier Emission3 analysis on how procurement teams budget for emissions totals but 2026 audit costs are set by supplier engagement structure and data tier mix.