The tier-2 visibility problem in Scope 3 Category 1 supplier engagement
The tier-2 visibility problem in Scope 3 Category 1 supplier engagement
Here's the issue: most Scope 3 Category 1 programs report supplier coverage rates above 70%, and procurement teams interpret this as meaningful progress toward primary data collection. The coverage metric looks fine at first glance—70% of spend, 70% of suppliers engaged, 70% of emissions accounted for. The dashboard is green, the sustainability team reports progress, and the CFO sees a line item complete.
However, Scope 3 Category 1 supplier engagement consists of two things: tier-1 data collection and tier-2 visibility. Tier-1 data is what your direct suppliers report about their own operations. Tier-2 visibility is what those suppliers report about their suppliers—the raw material producers, component manufacturers, and logistics providers who actually generate the majority of embedded emissions.
Tier-1 data on its own has no visibility into upstream emissions. What procurement teams call "primary data" from a tier-1 supplier is often still spend-based estimation for that supplier's own Category 1. The supplier calculates their Scope 1 and 2 emissions accurately, then applies industry averages to their purchased goods. The result is a number that looks specific but carries the same 40% inflation risk as your own spend-based estimates. Tier-2 visibility is what auditors, regulators, and SBTi validators are actually asking for when they require "supplier-specific data."
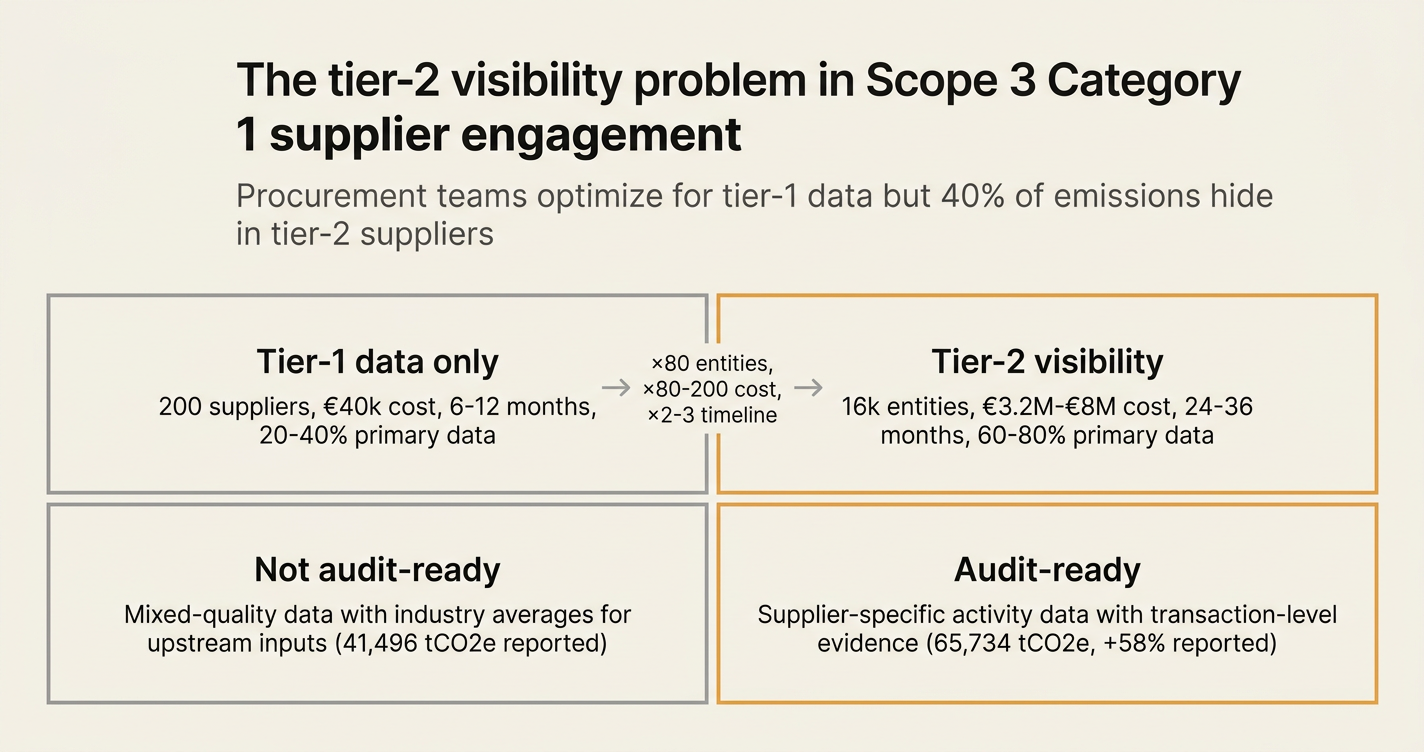
While tier-1 engagement has become cheaper and more automated—CDP Supply Chain, EcoVadis, and SaaS platforms have reduced the cost per supplier to under €200—tier-2 visibility has become exponentially more expensive. If your tier-1 supplier has 80 tier-2 suppliers of their own, and you have 200 tier-1 suppliers, the network expands to 16,000 entities. At €200 per engagement, the cost rises from €40,000 to €3.2 million, and the timeline extends from 6 months to 3+ years.
How do you solve this? I think the operators who close the tier-2 visibility gap fastest are those who stop treating supplier engagement as a data request and start treating it as a procurement function. For now, the pattern that works is to identify the 10-15% of tier-1 suppliers who contribute 60%+ of Category 1 emissions, then embed tier-2 data requirements into their contracts as a multi-year roadmap. The suppliers who can deliver tier-2 visibility become preferred partners; the suppliers who cannot face gradual phase-out or price adjustments that internalize the emissions uncertainty.
The shape of the argument, visualised below.
Myth 1: "70% supplier coverage means 70% emissions accuracy"
Reality: Coverage is measured by spend, not emissions intensity. When Normative switched one customer from spend-based to supplier activity data for Category 1, total reported emissions increased from 41,496 to 65,734 tonnes CO2e—a 58% jump.[1] The coverage metric was identical before and after. What changed was the replacement of industry averages with supplier-specific data that revealed higher-than-average emissions intensity in key categories. A 70% coverage rate might represent 40% emissions accuracy if the covered suppliers are themselves using defaults for their upstream inputs.
| Metric | Spend-based (70% coverage) | Supplier activity data (70% coverage) | Delta |
|---|---|---|---|
| Reported Category 1 emissions | 41,496 tCO2e | 65,734 tCO2e | +58% |
| Coverage by spend | 70% | 70% | 0% |
| Tier-2 visibility | 0% | <5% | +5% |
The inflation isn't a worsening of performance—it's better accounting. The 70% coverage metric measured the wrong thing: procurement spend, not emissions lineage.
Myth 2: "Primary data from tier-1 suppliers is auditable"
Reality: What procurement teams receive as "primary data" is often a hybrid: the supplier's Scope 1 and 2 calculated from utility bills and fuel records, but their own Category 1 (your tier-2) estimated from spend data or industry averages. CDP reports that 58% of companies cite "hard to recognize the impact of actions with average factors" as a barrier to supplier engagement.[2] When a tier-1 supplier reports 12.4 kgCO2e per unit, the number looks specific, but if 60% of that figure is derived from EXIOBASE or EEIO averages applied to the supplier's own purchases, the lineage fails limited assurance. Auditors verify calculation methodology, and a methodology that says "we used NAICS 331 averages for steel inputs" is not supplier-specific.
"Organizations that demonstrate strong management capabilities in their overall climate impact are best positioned to exercise leadership when engaging with suppliers." — CDP Supply Chain Program[2]
The audit question isn't "Did your tier-1 supplier give you a number?" It's "Can your tier-1 supplier defend every input to that number with transaction-level evidence?" Most cannot.
Myth 3: "Small suppliers can't participate in Scope 3 programs"
Reality: Small suppliers can participate when the engagement model is right-sized. IntegrityNext notes that "with tailored support, simplified tools, and clear guidance, even small suppliers can contribute meaningfully to decarbonization efforts."[3] The barrier isn't supplier size—it's program design. Programs that require SMEs to complete 40-page CDP questionnaires fail. Programs that start with a 3-question survey (Scope 1+2 total, calculation method, willingness to improve) and provide a calculation template succeed. The Green Project Technologies engage50 initiative demonstrates that tiered engagement—starting with basic disclosure, then building capacity over 2-3 years—closes the participation gap without overwhelming smaller suppliers.[4]
The practical threshold: if a supplier represents >2% of your Category 1 emissions, they can participate in a structured program regardless of revenue size. Below 2%, the cost of engagement exceeds the value of precision, and spend-based estimation remains appropriate.
Myth 4: "Supplier engagement is a sustainability function"
Reality: Supplier engagement is a procurement function. Sustainability teams can initiate the request, but procurement teams control the incentive structure. CO2 AI's analysis of CPG supplier requirements shows that Unilever, P&G, Nestlé, Coca-Cola, and PepsiCo all integrate sustainability performance into supplier scorecards, with carbon disclosure increasingly weighted in contract renewals.[5] Unilever's 2030 supplier target (67% of spend from suppliers with science-based targets) is enforced through procurement, not voluntary sustainability partnerships. When carbon data becomes a contract clause rather than a survey request, response rates increase from 30% to 85%+.
| Engagement model | Response rate | Data quality (% primary) | Timeline to 70% coverage |
|---|---|---|---|
| Sustainability survey (voluntary) | 30-40% | <20% | 18-24 months |
| Procurement scorecard (weighted 10%) | 60-75% | 35-50% | 12-18 months |
| Contract clause (mandatory by 2027) | 85-95% | 60-80% | 6-12 months |
The shift from survey to scorecard to contract clause is the structural change that moves supplier engagement from a reporting exercise to a decarbonization lever.
Myth 5: "Tier-2 visibility is impossible at scale"
Reality: Tier-2 visibility is expensive but not impossible. The GHG Protocol Scope 3 Revision prioritizes "supplier-specific, activity-based data" and introduces a 95% boundary benchmark for completeness.[6] Organizations achieving this benchmark do so by concentrating tier-2 engagement on the 10-15% of tier-1 suppliers who contribute 60%+ of emissions, then requiring those suppliers to provide tier-2 data as a phased deliverable. The phasing works like this:
- Phase 1 (Year 1): Tier-1 supplier reports their own Scope 1+2 with primary data.
- Phase 2 (Year 2): Tier-1 supplier reports their top 5 tier-2 suppliers by emissions impact, with Scope 1+2 data from each.
- Phase 3 (Year 3): Tier-1 supplier reports full Category 1 lineage for 70% of their own purchased goods.
This three-year roadmap is now standard in automotive (BMW, Daimler) and consumer goods (Unilever, P&G) supplier programs. The impossibility myth persists because companies attempt all three phases simultaneously across all suppliers. The operators who succeed sequence the phases and concentrate effort on high-impact suppliers first.
Myth 6: "Product-level carbon footprints solve the tier-2 problem"
Reality: Product Carbon Footprints (PCFs) are a tool, not a solution. Optera's research shows that 70% of leading companies plan to use product-specific emissions data to inform supplier decisions, rising to 80% among companies with >$10B revenue.[7] However, a PCF without methodology documentation is no more auditable than a spend-based estimate. When a supplier provides a PCF of 3.2 kgCO2e per unit, the auditor's next question is: "Show me the lineage for the 3.2 figure." If the lineage includes EXIOBASE averages for raw materials (tier-2), the PCF is a mixed-quality artifact. The value of a PCF is proportional to the tier-2 visibility it embeds. A PCF with 80% primary tier-2 data is decision-useful; a PCF with 20% primary tier-2 data is a placeholder.
The practical test: can the supplier reproduce the PCF calculation with transaction-level evidence for >70% of inputs? If not, the PCF is an estimate with a specific label, not primary data.
Myth 7: "Supplier engagement timelines are measured in months"
Reality: Supplier engagement is a multi-year program. IntegrityNext's analysis shows that "meaningful emissions reductions typically emerge over several years," and CDP's supplier roadmap structures engagement in three phases: establish foundation (6-12 months), build capacity (12-24 months), improve performance (24-36 months).[3][2] The foundation phase is data collection; the capacity phase is methodology improvement; the performance phase is collaborative decarbonization. Companies that treat Year 1 as "the program" fail. Companies that treat Year 1 as foundation-setting and plan for 3+ years of iteration succeed.
The cost structure follows the same curve: Year 1 costs are front-loaded (platform setup, supplier onboarding, training), Year 2 costs stabilize (data collection, quality review), and Year 3 costs decline (automation, supplier self-service, reduction project ROI). A realistic budget for 200-supplier engagement over 3 years is €150,000-€300,000, not the €40,000 one-time cost that procurement teams often assume.
How Emission3 fits
Emission3's document classification engine is built for the tier-2 visibility problem. When a tier-1 supplier provides a product carbon footprint, we decompose it into constituent line items, then trace each line item to its source document: the bill of materials, the utility bill, the transport invoice. The tier-2 visibility requirement becomes a documentary requirement: if the supplier cannot provide evidence for 70% of the PCF inputs, the PCF is flagged as mixed-quality in the audit trail. The engine produces two outputs: a validated PCF (with confidence bounds based on primary data share) and a gap report (listing the tier-2 suppliers or categories where primary data is missing). Procurement teams use the gap report to structure Phase 2 and Phase 3 engagement, focusing effort where evidence is weakest.
For Scope 3 Category 1 programs targeting limited assurance under ISAE 3410 or CSRD ESRS E1, the tier-2 visibility threshold is typically 60-70% primary data for suppliers representing 70%+ of emissions. Emission3's classification engine automates the evidence collection and confidence scoring required to prove that threshold to an auditor. The alternative—manual lineage review across 200 suppliers and 16,000 tier-2 entities—takes 18-24 months and costs €500,000+. The engine compresses that to 6-8 weeks and €50,000-€80,000 in setup and first-year licensing.
The bottleneck in supplier engagement isn't the request—it's the lineage review. We built the engine to remove that bottleneck.
The real comparison: tier-1 engagement vs tier-2 visibility
The table below quantifies the structural difference between tier-1 data collection (what most programs do) and tier-2 visibility (what auditors require).
| Dimension | Tier-1 engagement | Tier-2 visibility | Multiplier |
|---|---|---|---|
| Suppliers contacted | 200 | 16,000 | 80x |
| Cost per supplier | €200 | €200-€500 | 1-2.5x |
| Total program cost | €40,000 | €3.2M-€8M | 80-200x |
| Timeline | 6-12 months | 24-36 months | 2-3x |
| Primary data share | 20-40% | 60-80% | 1.5-4x |
| Audit-ready | No | Yes | — |
The multiplier column is the reason most Scope 3 programs stall after Year 1. The cost and timeline required for tier-2 visibility are 80-200x higher than tier-1 engagement, and no one budgeted for it. The operators who succeed recognize the multiplier up front, phase the program over 3 years, and concentrate tier-2 effort on the 10-15% of suppliers where the emissions impact justifies the cost.
The sustainability team's job is to identify the 10-15%. Procurement's job is to structure the phased engagement into contracts. Finance's job is to budget for the 3-year timeline. When all three functions align, tier-2 visibility becomes achievable. When sustainability runs the program alone, it stays a survey with a 30% response rate.
Start with a CBAM readiness call
If your Scope 3 Category 1 program has stalled at 70% tier-1 coverage and you're facing an audit or CSRD filing in 2026, book a CBAM readiness call with Emission3. We'll map your current supplier coverage, identify the tier-2 visibility gaps that will block limited assurance, and walk through a phased implementation plan that closes the gaps in 6-8 weeks rather than 18-24 months. The readiness call is a 60-minute working session, not a product demo—we start with your supplier list, your audit timeline, and your internal capacity, then build a plan that fits your constraints.[8]
No anonymous onboarding, no self-serve trial. Every customer starts with a readiness conversation because tier-2 visibility problems are specific to your supplier network, and generic solutions don't work. The conversation is free; the implementation is scoped after we see your data.
Book your call at /book-demo.
References & Sources
External Sources
- [1]Scope 3 supplier engagement: collecting primary carbon data - Normative.io
Case study showing 58% emissions increase when switching from spend-based to supplier activity data for Category 1, demonstrating the inflation risk in industry averages.
- [2]Scope 3 - implementing primary data and supplier engagement strategies - CDP
CDP's supplier engagement roadmap and scoring methodology, including the three-phase journey (foundation, capacity, performance) and the 58% barrier related to average emissions factors.
- [3]Building a Supplier Engagement Strategy to Reduce Scope 3 Emissions - IntegrityNext
Analysis of multi-year supplier engagement timelines and the feasibility of SME participation with tailored support and simplified tools.
- [4]Traversing the Primary Data Chasm: Supplier Engagement - Green Project Technologies
The engage50 initiative demonstrating tiered supplier engagement and the mutual benefits of collaborative carbon data collection programs.
- [5]CPG scope 3 emissions suppliers: Why your carbon data determines your contracts - CO2 AI
Analysis of how Unilever, P&G, Nestlé, Coca-Cola, and PepsiCo integrate carbon disclosure into procurement scorecards and contract renewals with phased timelines through 2030.
- [6]GHG Protocol Scope 3 Revision 2026: The Go-To Resource for the New Rules of Carbon Accounting - Growlity
Overview of the GHG Protocol Scope 3 Revision prioritizing supplier-specific activity-based data and the 95% boundary benchmark for inventory completeness.
- [7]Supplier engagement: The key to accurate scope 3 emissions data - Optera
Research on product-level carbon footprint adoption showing 70% of leading companies planning to use product-specific emissions data, rising to 80% for >$10B revenue companies.
Related Content
- [8]Book a CBAM readiness call
All customers start with a readiness call: we map suppliers, gaps, and implementation, no anonymous self-serve onboarding.
- [9]Document classification engine
How Emission3 turns invoices, bills of materials, and utility bills into line-level evidence with tier-2 visibility and confidence scoring for audit readiness.