The supplier data coverage gap in Scope 3 Category 1 disclosure
The supplier data coverage gap in Scope 3 Category 1 disclosure
Here's the issue: procurement teams now face mandatory Scope 3 Category 1 disclosure under CSRD and SB 253, and most believe they can meet the requirement by collecting emissions data from their top 50 or 100 suppliers. That approach looks adequate at first glance—those suppliers often represent 60-70% of procurement spend, and 60-70% feels like reasonable coverage for a first-year filing. The resulting emissions inventory appears complete, the spreadsheet exports cleanly, and the sustainability team marks the task as done.
However, Scope 3 Category 1 disclosure consists of two things: supplier count and spend coverage. Supplier count is the number of organisations you have collected primary emissions data from. Spend coverage is the proportion of total procurement spend those organisations represent, weighted by the materiality of each category to your total footprint.
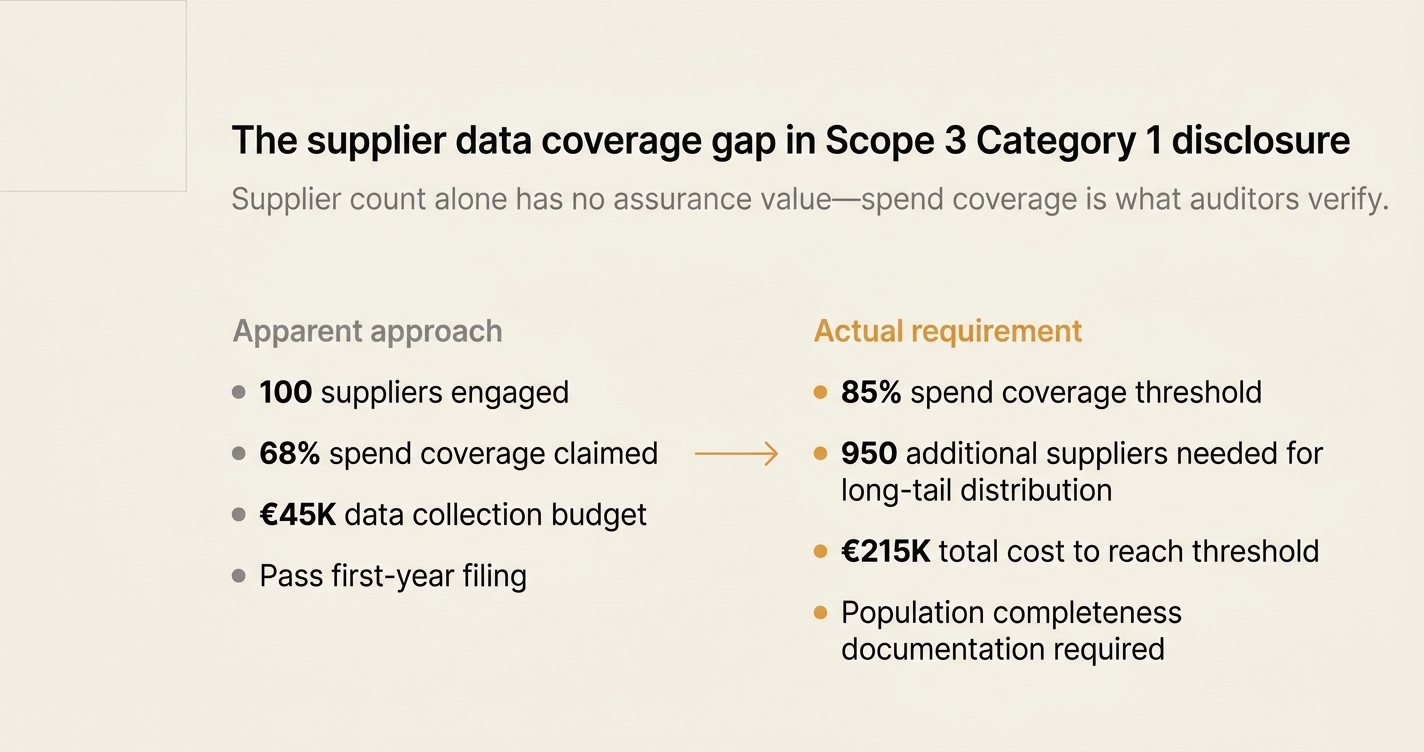
Supplier count on its own has no value. Spend coverage is what the auditor is actually verifying. A procurement team that has collected data from 100 suppliers might report 68% spend coverage, but if the remaining 32% of spend is concentrated in high-carbon categories—steel fabrication, chemical feedstocks, international logistics—the disclosed emissions total will systematically understate the true footprint. The auditor will flag the gap, and the filing will fail limited assurance.
While supplier engagement has become easier—76% of large suppliers now publish Scope 1 and 2 data in annual reports, according to EcoVadis' 2025 benchmarking study—spend-weighted coverage has become harder. The long tail of tier-2 suppliers, who collectively account for 25-40% of most manufacturers' spend, lack the systems to produce primary data. If your top-100 suppliers represent 70% of spend, the remaining 30% might require outreach to another 800-1200 organisations. The cost of achieving 85% spend coverage—the emerging threshold for limited assurance under CSRD—might outpace the cost of the initial 70%.
How do you solve this? I think procurement teams need to reframe Scope 3 Category 1 as a population completeness problem, not a supplier engagement problem. The operators we work with start by mapping spend to emission intensity, then segment suppliers into three tiers: strategic (primary data required), material (hybrid data acceptable if verified), and long-tail (average-data permissible if documented). That segmentation determines where to invest in primary data collection, and where secondary data remains defensible. For now, the goal is not 100% primary data—it is 85% spend coverage with documented evidence lineage for the remaining 15%.
The shape of the argument, visualised below.
What 85% spend coverage actually requires
The GHG Protocol Scope 3 Standard Phase 1 revisions, effective March 2026, introduce mandatory data-type disaggregation. Organisations must now report, for each Scope 3 category, the proportion of data that is supplier-specific, hybrid, average-data or spend-based, and whether that data is fully verified, partially verified or not verified [1]. CSRD ESRS E1 applies the same requirement, and the European Financial Reporting Advisory Group has signalled that spend-based data for material categories will attract qualified audit opinions [1].
That shift changes the math of supplier engagement. The table below compares two procurement portfolios—both with 100 supplier relationships, both claiming 70% spend coverage, but with different spend distributions:
| Portfolio characteristic | Portfolio A: Pareto distribution | Portfolio B: Long-tail distribution |
|---|---|---|
| Top 10 suppliers (% of spend) | 45% | 28% |
| Next 40 suppliers (% of spend) | 25% | 27% |
| Next 50 suppliers (% of spend) | 8% | 15% |
| Remaining suppliers (count) | 1,200 | 2,400 |
| Remaining suppliers (% of spend) | 22% | 30% |
| Estimated outreach to reach 85% coverage | 180 suppliers | 950 suppliers |
| Estimated cost to reach 85% coverage | €45,000 | €215,000 |
Portfolio A benefits from natural concentration: the top 50 suppliers account for 70% of spend, and the next 180 suppliers add another 15%. Portfolio B faces fragmentation: the same 50-supplier cohort covers only 55% of spend, and reaching 85% requires engaging nearly 1,000 additional organisations. The cost difference—€45,000 versus €215,000—reflects the labour hours required to request, validate, and reconcile data from smaller suppliers who lack standardised reporting infrastructure.
The 85% threshold is not arbitrary. It derives from the materiality assessment requirements in CSRD Article 29b and the GHG Protocol's guidance on scope 3 target coverage. According to SBTi Corporate Near-Term Criteria, scope 3 targets must collectively cover at least 67% of total scope 3 emissions [2]. CSRD raises the bar: material categories require data quality sufficient for limited assurance, which most practitioners interpret as 80-90% spend coverage with documented evidence for exclusions [3].
The three-tier supplier segmentation model
Procurement teams that achieve 85% spend coverage without budget overruns use a segmentation model that treats different supplier cohorts differently. The model has three tiers, defined by the combination of spend contribution and emission intensity:
Tier 1: Strategic suppliers (primary data required). These are suppliers whose individual contribution exceeds 2% of total procurement spend, or whose products fall into high-emission categories regardless of spend. Examples include steel mills, chemical manufacturers, tier-1 logistics providers, and energy-intensive component suppliers. For these suppliers, you request:
- Site-specific Scope 1 and 2 emissions data, verified by third-party audit or aligned with ISO 14064-1.
- Activity data for transported goods (tonne-kilometres) or fuel consumption (litres by fuel type).
- Product-level emissions factors where available, or sufficient granularity to calculate them.
According to Normative's supplier engagement benchmarking, 68% of tier-1 suppliers can now provide this data within 45 days of request, up from 34% in 2022 [2]. The cost per supplier averages €800-1,200 in internal labour hours (sustainability team + procurement follow-up).
Tier 2: Material suppliers (hybrid data acceptable if verified). These are suppliers whose individual contribution is 0.5-2% of spend, or whose emission intensity is moderate. Examples include packaging suppliers, tier-2 component manufacturers, and regional logistics partners. For these suppliers, you accept:
- Industry-average emissions factors from recognised databases (Ecoinvent, GaBi, DEFRA), adjusted for supplier location and energy grid.
- Partial primary data—for example, supplier-reported electricity consumption paired with grid factors.
- Spend-based estimates where activity data is unavailable, provided the emission factor is traceable and the spend allocation is auditable.
The GHG Protocol explicitly permits this approach: "In certain cases, companies may use specific data from one activity in the value chain to estimate emissions for another activity in the value chain. This type of data (i.e., proxy data) is considered secondary data, since it is not specific to the activity whose emissions are being calculated" [3]. The cost per supplier averages €200-400.
Tier 3: Long-tail suppliers (average-data permissible if documented). These are suppliers whose individual contribution is below 0.5% of spend, and whose products are low-emission or administratively intensive to track. Examples include office supplies, IT services, and non-strategic consumables. For these suppliers, you use:
- Spend-based emissions factors, applied to financial data already in the ERP system.
- Industry-average data from published databases, with documented assumptions.
- Population completeness documentation: a signed statement from the CFO or procurement director confirming that the long-tail cohort has been identified, and that no material suppliers have been excluded.
The cost per supplier is effectively zero—once the methodology is established, the calculation is automated. The documentation cost is the bottleneck: proving population completeness requires a procurement data audit that most organisations have not performed.
"To most effectively track performance, companies should use primary data collected from suppliers and other value chain partners for scope 3 activities targeted for achieving GHG reductions. In some cases, primary data may not be available or may not be of sufficient quality. In such cases, secondary data may be of higher quality than the available primary data for a given activity." — GHG Protocol Scope 3 FAQ [3]
Why spend coverage fails without population completeness documentation
The segmentation model above solves the cost problem, but it introduces a new risk: exclusion bias. If your tier-1 and tier-2 suppliers represent 85% of spend, how do you prove to an auditor that the remaining 15% does not contain any undisclosed high-emitters?
This is the population completeness problem. It is distinct from data quality, and it is the failure mode most procurement teams miss. An auditor performing limited assurance does not just verify the accuracy of the emissions data you have collected—they verify that you have identified all material suppliers, and that your exclusions are justified and documented.
According to Wolters Kluwer's guidance for internal audit teams reviewing Scope 3 supplier emissions, the core assurance questions are [4]:
- Has the organisation identified all tier-1 suppliers with whom it has a direct purchase order?
- Has the organisation assessed the materiality of each supplier, using both spend contribution and emission intensity?
- For suppliers excluded from primary data collection, has the organisation documented the exclusion rationale and applied appropriate estimation methods?
- Can the organisation prove that the supplier list is complete—i.e., that no material suppliers have been omitted?
Most procurement teams can answer questions 1-3. Question 4 is where filings fail. Proving completeness requires three artifacts:
Artifact 1: A reconciled supplier master file. This is a single list of all organisations the company has transacted with in the reporting period, deduplicated and matched to a unique identifier (DUNS, LEI, or equivalent). The file must reconcile to total procurement spend in the ERP system, with variances below 2%. Most companies discover 8-15% spend variance when they attempt this reconciliation for the first time—duplicate vendor records, misclassified spend categories, and inter-company transactions that were not flagged.
Artifact 2: A materiality assessment matrix. This is a two-dimensional grid that classifies each supplier by spend contribution (x-axis) and emission intensity (y-axis). Suppliers in the top-right quadrant are tier-1 (high spend, high intensity); suppliers in the bottom-left are tier-3 (low spend, low intensity). The matrix must be signed off by the head of procurement and the CFO, and it must include a written justification for any supplier that was moved from tier-1 to tier-2 or tier-3 based on qualitative factors.
Artifact 3: A data-type coverage report. This is a summary table, by Scope 3 category and by supplier tier, showing the proportion of spend covered by supplier-specific data, hybrid data, average-data, and spend-based data. The table must reconcile to the emissions total in the disclosure, with a documented audit trail from supplier data to final figure. EcoVadis' Carbon Action Manager automates this reporting, linking supplier-level data collection to portfolio-level aggregation [5].
Without these three artifacts, spend coverage is unverifiable. An auditor cannot confirm that 85% coverage is real—or that the remaining 15% does not contain any excluded high-emitters. The filing will receive a qualified opinion, and the company will face a 6-9 month remediation cycle.
The cost of achieving 85% spend coverage in 2026
The table below shows the fully-loaded cost of reaching 85% spend coverage for a mid-sized manufacturer (€500M annual procurement spend, 1,800 active suppliers):
| Activity | Owner | Hours | External cost | Total cost | |---|---|---|---| | Supplier master file reconciliation | Procurement + IT | 120 | €15,000 (data consultant) | €28,000 | | Materiality assessment matrix | Sustainability + CFO | 40 | €0 | €6,000 | | Tier-1 supplier engagement (50 suppliers) | Procurement + Sustainability | 180 | €0 | €27,000 | | Tier-2 supplier engagement (200 suppliers) | Procurement | 120 | €0 | €18,000 | | Data validation and reconciliation | Sustainability | 80 | €8,000 (data quality audit) | €20,000 | | Data-type coverage reporting | Sustainability | 30 | €0 | €4,500 | | Population completeness documentation | Internal audit | 50 | €0 | €7,500 | | Total | | 620 | €23,000 | €111,000 |
The €111,000 figure assumes internal labour at €150/hour (blended rate for procurement and sustainability staff) and external costs for data reconciliation and audit support. It does not include software license fees, which range from €25,000-€75,000 annually for enterprise carbon accounting platforms.
For comparison, the cost of spend-based estimation across the entire portfolio—using ERP data and published emission factors—is approximately €18,000 (120 hours of sustainability team time to set up the methodology and document assumptions). The €93,000 difference is the cost of moving from 70% average-data to 85% spend coverage with primary and hybrid data.
That cost is justified only if the organisation faces regulatory assurance requirements (CSRD, SB 253), or if it has committed to science-based targets that require supplier engagement. For organisations in neither category, spend-based estimation remains the defensible choice—provided it is documented transparently and updated annually.
How Emission3 fits
Emission3 solves the population completeness problem by treating supplier data coverage as a document classification workflow, not a data collection exercise. The platform ingests procurement data directly from ERP systems (SAP, Oracle, Coupa), classifies suppliers into materiality tiers using spend and emission intensity, and generates the three artifacts auditors require: reconciled supplier master file, materiality assessment matrix, and data-type coverage report.
For tier-1 suppliers, Emission3 automates primary data requests using standardised templates aligned with GHG Protocol Category 1 guidance. For tier-2 suppliers, the platform applies hybrid methods—matching supplier location and product category to regional emission factors, adjusted for energy grid mix. For tier-3 suppliers, Emission3 uses spend-based factors but documents the exclusion rationale and provides population completeness evidence.
The result: procurement teams achieve 85% spend coverage in 8-12 weeks, with full audit trail from ERP transaction to disclosed emission total. Every number is reproducible, every exclusion is justified, and every data-type proportion is verifiable. The platform exports evidence packs in the format CSRD and SB 253 auditors expect—no spreadsheet archaeology, no missing documentation, no unexplained variances.
If you are preparing for a 2026 CSRD or SB 253 filing, and you need to move from spend-based estimates to spend-weighted primary data, book a CBAM readiness call [6]. We will map your supplier base, identify your tier-1 cohort, and show you what 85% coverage looks like in your portfolio—before you invest in data collection infrastructure.
Where to start
✅ Step 1: Reconcile your supplier master file. Export all procurement transactions from the ERP system for the reporting period. Deduplicate vendor records, match to unique identifiers (DUNS or LEI), and reconcile total spend to the general ledger. Variance must be below 2%. Owner: Procurement + IT. Evidence artifact: Signed reconciliation report from CFO.
✅ Step 2: Build the materiality assessment matrix. Classify suppliers into tiers using spend contribution and emission intensity. Use GHG Protocol Category 1 guidance to assign intensity scores by product category. Flag any suppliers moved from tier-1 to tier-2 based on qualitative factors. Owner: Sustainability + Procurement. Evidence artifact: Signed materiality matrix with written justifications.
✅ Step 3: Engage tier-1 suppliers for primary data. Send standardised data requests to all suppliers whose individual contribution exceeds 2% of spend, or whose products fall into high-emission categories. Request site-specific Scope 1 and 2 data, verified or aligned with ISO 14064-1. Owner: Procurement + Sustainability. Evidence artifact: Supplier data submissions with verification statements.
✅ Step 4: Apply hybrid methods for tier-2 suppliers. For suppliers whose individual contribution is 0.5-2% of spend, use industry-average emission factors adjusted for supplier location and energy grid. Document the data sources and assumptions. Owner: Sustainability. Evidence artifact: Calculation workbook with traceable emission factors.
✅ Step 5: Document exclusions for tier-3 suppliers. For suppliers below 0.5% of spend, use spend-based factors applied to ERP data. Document the exclusion rationale and confirm that no material suppliers have been omitted. Owner: Sustainability + CFO. Evidence artifact: Signed statement of population completeness.
✅ Step 6: Generate the data-type coverage report. Summarise, by Scope 3 category and by supplier tier, the proportion of spend covered by supplier-specific, hybrid, average-data, and spend-based data. Reconcile to the emissions total in the disclosure. Owner: Sustainability. Evidence artifact: Data-type coverage table with audit trail.
✅ Step 7: Prepare population completeness documentation. Compile the reconciled supplier master file, materiality assessment matrix, and data-type coverage report into a single evidence pack. Include a signed statement from the CFO confirming that the supplier list is complete and that all material suppliers have been identified. Owner: Internal audit. Evidence artifact: Population completeness evidence pack.
✅ Step 8: Submit for limited assurance. Provide the evidence pack to your third-party auditor at least 90 days before the filing deadline. CSRD limited assurance engagements now require 12-16 weeks lead time, according to PwC's 2025 benchmarking study. Owner: Sustainability + CFO. Evidence artifact: Auditor sign-off letter.
The spend coverage gap is not a data problem—it is a governance problem. Procurement teams that solve it in 2026 will have built the infrastructure that makes 2027 and 2028 filings routine. Procurement teams that ignore it will face qualified audit opinions, remediation cycles, and compounding documentation debt.
If you are preparing for your first CSRD or SB 253 filing, the time to build population completeness documentation is now—not three months before the deadline. Book a CBAM readiness call [6], and we will show you what 85% spend coverage looks like in your procurement portfolio.
References & Sources
External Sources
- [1]Activity-based vs Production-based vs Spend-based Emission Factors
Net0's analysis of the GHG Protocol Scope 3 Standard Phase 1 revisions (March 2026) introducing mandatory data-type disaggregation and verification labelling requirements.
- [2]Scope 3 Supplier Engagement: Primary Carbon Data
Normative's guide to supplier engagement covering the three-phase strategy for collecting primary data, what to ask for, and what 90% scope 3 coverage looks like in practice.
- [3]Scope 3 Frequently Asked Questions
GHG Protocol official guidance on primary versus secondary data selection, supplier engagement strategies, and documentation requirements for Scope 3 reporting.
- [4]Scope 3 Emissions Reporting: The Role of Internal Audit
Wolters Kluwer's framework for internal audit review of Scope 3 supplier emissions, including completeness verification and population assessment procedures.
- [5]How to Build a Credible Scope 3 Reporting Program in 2026
EcoVadis' operational guide to Scope 3 reporting covering supplier engagement challenges, data collection workflows, and the transition from estimates to primary data.
Related Content
- [6]Book a CBAM readiness call
All customers start with a readiness call: we map suppliers, gaps, and implementation—no anonymous self-serve onboarding.
- [7]Scope 3 with primary data
How Emission3 transforms procurement data into audit-grade Scope 3 Category 1 disclosure with documented evidence lineage and population completeness verification.