The default-value penalty for 2026 CBAM filings
The default-value penalty for 2026 CBAM filings
Here's the issue: non-EU exporters face a cliff on 1 January 2026 when the Carbon Border Adjustment Mechanism transitional period ends. Firms that have been reporting quarterly emissions under the transitional regime will shift to permanent CBAM declarations, and for the first time, those declarations will determine tariff liability. A steel exporter shipping 10,000 tonnes of hot-rolled coil into the EU might estimate a CBAM certificate cost of €200,000 based on their internal emissions model. That number looks manageable in a forecast. But the actual tariff is not set by the exporter's estimate—it is set by the emissions value the EU accepts as verified.
However, a CBAM filing consists of two things: actual installation-level emissions data, and default values applied when actual data is missing or unverified. Exporters focus on the first—measuring fuel consumption, electricity invoices, process emissions at their own facilities. They assume that gathering this data is the bottleneck. But the EU regulation establishes sectoral default values for every covered good, and these defaults are applied automatically when a declarant cannot substantiate actual emissions. For hot-rolled steel, the default is approximately 2.2 tonnes CO₂ per tonne of product. For many installations, the true value is 0.9 to 1.3 tonnes. The default is punitive by design.
Actual emissions data on its own has no value in a CBAM filing if it cannot be verified. Default values are what the EU registry and the CBAM declarant's auditor are actually enforcing. A firm may report 1.0 tonne CO₂ per tonne of steel based on its own calculation, but if the verifier cannot trace that number to installation-level utility bills, fuel receipts, and a GHG Protocol–compliant calculation methodology, the registry applies the default. The declarant pays the tariff on 2.2 tonnes, not 1.0. The inversion is this: the cost of the filing is not driven by the complexity of measuring emissions—it is driven by the penalty for failing to verify them.
While the cost of emissions measurement has decreased—software tools, consultants, and internal sustainability teams have proliferated—the cost of verification has increased. Under the CBAM Implementing Regulation, verifiers must be accredited to ISO 17029 and must review every calculation step, every source document, and every allocation assumption. If a steel mill sources electricity from a grid with no hourly carbon intensity data, the verifier cannot accept a simple annual average. If a declarant aggregates emissions across multiple production lines without line-item traceability, the verifier cannot sign off. A firm that invested €50,000 in emissions measurement may face a €150,000 verification bill—and still fail verification if the evidence lineage is incomplete. In that scenario, the exporter pays the default-value tariff on 100% of shipped volume. For a 10,000-tonne shipment, the penalty is approximately €1.32 million at current EU ETS prices, versus €540,000 if actual emissions had been verified. The delta—€780,000—is the default-value penalty.
How do you solve this? I think the answer is to start with the evidence artifact, not the emissions total. The operators we work with at Emission3 begin by mapping every utility bill, every fuel receipt, every electricity invoice to a specific production batch or time window. They treat CBAM preparation as a document-assembly problem, not a calculation problem. For steel exporters, this means tagging every natural gas invoice to a furnace run, every electricity bill to a rolling mill shift, every limestone delivery to a sinter plant batch. The emissions total is the output of that assembly, not the input. When the verifier arrives, they are reviewing a pre-built evidence pack—line-item source documents, a deterministic calculation lineage, and a submission-ready CBAM XML file. The cost of verification drops because the verifier is not reconstructing the calculation from scratch. And the probability of passing verification on the first cycle approaches 100%, which is what eliminates the default-value penalty.
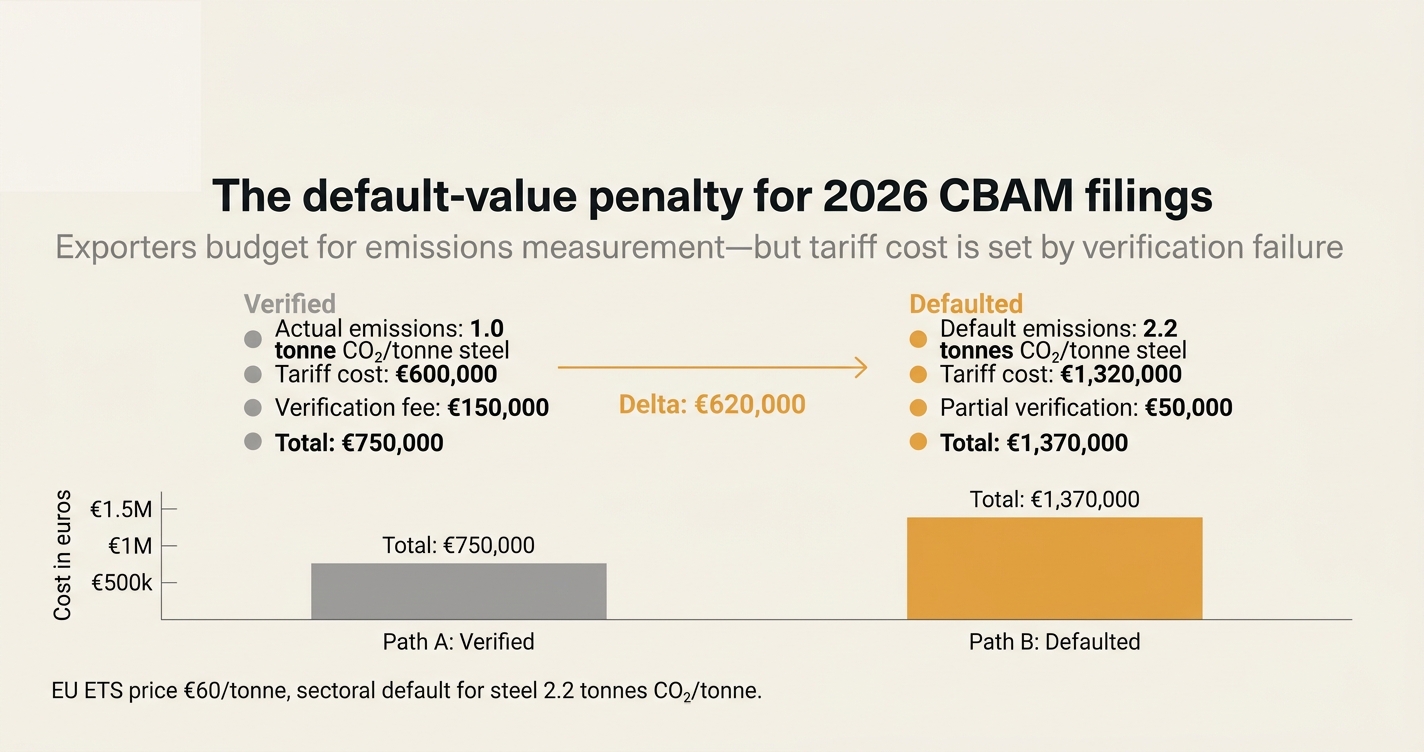
Visualised below.
The two paths through 2026 CBAM filings
Every non-EU exporter entering the permanent CBAM regime on 1 January 2026 will take one of two paths through their first filing cycle. The table below shows the workflow, the cost structure, and the tariff outcome for each path.
| Filing path | Measurement approach | Verification outcome | Tariff basis | Cost per 10,000 tonnes shipped (EU ETS price: €60/tonne) |
|---|---|---|---|---|
| Path A: Actual emissions verified | Installation-level data, fuel receipts, electricity invoices, allocation methodology documented line-by-line. | Verifier signs off on first review cycle. Actual emissions value accepted by EU registry. | Actual emissions: 1.0 tonne CO₂/tonne steel. | €600,000 (10,000 tonnes × 1.0 tonne CO₂ × €60) + €150,000 verification = €750,000 total programme cost. |
| Path B: Default value applied | Internal emissions model, no line-item traceability, missing utility bills for 15% of production volume. | Verifier cannot substantiate calculation. EU registry applies sectoral default. | Default emissions: 2.2 tonnes CO₂/tonne steel. | €1,320,000 (10,000 tonnes × 2.2 tonnes CO₂ × €60) + €50,000 partial verification = €1,370,000 total programme cost. |
| Delta (Path B penalty) | — | — | — | €620,000 |
The default-value penalty is not a one-time cost. It recurs every quarter for every shipment where verification fails. A firm that ships 40,000 tonnes per year and fails verification on 25% of volume will pay an additional €620,000 annually compared to a competitor that passes verification on 100% of volume. Over a three-year period, the cumulative penalty is €1.86 million. That number exceeds the cost of building SOX-grade evidence infrastructure for most mid-sized exporters.
The installation-level data problem
The CBAM Implementing Regulation defines "installation" as "a stationary technical unit where production processes are carried out" and requires emissions to be calculated "at the level of the installation where the goods are produced."[1] This is a stricter standard than most corporate GHG inventories, which aggregate emissions at the facility or legal-entity level. A steel mill that reports total Scope 1 emissions of 50,000 tonnes CO₂ per year cannot use that number in a CBAM filing if the mill produces both hot-rolled coil and cold-rolled coil on separate production lines. The regulation requires emissions to be allocated to each product, and the allocation methodology must be "verifiable, consistent, and based on relevant standards."[2]
For exporters that have not maintained installation-level records, reconstructing this data is expensive. A firm that throws away utility bills after 90 days cannot verify emissions for shipments that occurred six months ago. A firm that aggregates electricity consumption across multiple buildings cannot allocate emissions to a specific furnace run. The EU registry does not accept estimates, and verifiers are prohibited from signing off on calculations that rely on unsubstantiated assumptions. The result is that firms with incomplete records default to the sectoral value, even if their actual emissions are materially lower.
"The default values referred to in Article 7(1) shall be established by the Commission on the basis of the average emission intensity of each exporting country for each type of goods, increased by a mark-up reflecting the carbon price differential... Where no reliable data is available, the default values shall be based on the average emission intensity of the worst-performing 10 % of EU installations."
— CBAM Regulation (EU) 2023/956, Article 7(2)[3]
This is the mechanism that makes the default punitive. For steel, the worst-performing 10% of EU installations emit approximately 2.5 tonnes CO₂ per tonne of product. The sectoral default is set at the 90th percentile, not the median. Non-EU installations with emissions at the global median—around 1.8 tonnes—still pay a penalty of 20% versus their actual footprint. Installations with emissions below 1.5 tonnes, common in electric-arc-furnace mills, pay a penalty of 40% or more. The default is not a neutral fallback—it is a compliance tax on firms that cannot verify.
✅ Checklist: Close the default-value gap before 1 January 2026
This checklist is for CFOs and finance leaders at non-EU exporters shipping CBAM-covered goods into the EU. Each step produces a specific artifact that a verifier will request during the first filing cycle. If any step is incomplete by 31 December 2025, the firm will pay the default-value tariff on that portion of shipped volume.
1. Map every production installation to a CBAM product category
Owner: Operations director, with legal review.
✅ Done when: A table exists that lists every production line, every furnace, every mill, and the six-digit CN code of the output. This is the unit of analysis for CBAM. If your firm produces both 7208 (hot-rolled steel) and 7209 (cold-rolled steel) on separate lines, they are separate installations for CBAM purposes even if they share a facility boundary.
2. Identify the fuel and electricity meters for each installation
Owner: Plant engineer.
✅ Done when: A schematic exists that shows which meters feed which production lines. Many facilities have a single electricity meter for the entire site. That meter cannot be used for CBAM unless you can allocate consumption to specific lines using a defensible methodology (e.g., runtime logs, kWh-per-tonne benchmarks verified against spot checks).
3. Collect utility bills for every meter, back to 1 January 2024
Owner: Accounts payable, procurement.
✅ Done when: Every electricity bill, every natural gas invoice, every diesel delivery receipt is digitised and tagged to a meter ID and a month. Verifiers will request 12–24 months of history. If you switched suppliers mid-year, you need invoices from both suppliers. If you threw away paper bills, request duplicates from the utility now—most utilities charge €50–200 per duplicate, and retrieval takes 6–12 weeks.
4. Retrieve electricity carbon intensity factors for every billing period
Owner: Sustainability analyst, with procurement support.
✅ Done when: A table exists that lists the carbon intensity (gCO₂/kWh) of the electricity you purchased in each month. If you bought grid electricity, use the country or regional grid factor published by the IEA or the local grid operator. If you bought renewable electricity with Guarantees of Origin (GOs), you need the GO registry certificates that match the billing periods. Verifiers will reject a generic "we buy green power" claim without monthly GO certificates.
5. Quantify process emissions for each installation
Owner: Process engineer, HSE manager.
✅ Done when: A calculation exists for non-combustion CO₂, such as limestone calcination in a blast furnace or carbonate decomposition in a cement kiln. These are Scope 1 emissions that do not appear on a utility bill. The calculation must cite a stoichiometric ratio (e.g., 1 tonne of limestone → 0.44 tonnes CO₂) and must be traceable to purchase invoices for the input material. If you estimate process emissions using a site-wide average, the verifier will reject it unless you can show line-item traceability.
6. Build the allocation methodology if you produce multiple products
Owner: Finance, operations, external consultant if necessary.
✅ Done when: A written document exists that explains how you allocate shared emissions to each product. Example: "Furnace A consumes 10,000 MWh per month and produces 8,000 tonnes of hot-rolled coil and 2,000 tonnes of rebar. Emissions are allocated by mass: 80% to coil, 20% to rebar." The methodology must be consistent with ISO 14064-1 or the GHG Protocol, and it must be applied the same way in every reporting period. If you change the methodology mid-year, the verifier will flag it.
7. Calculate embedded emissions per tonne for each product
Owner: Sustainability analyst.
✅ Done when: A spreadsheet exists that sums fuel emissions + electricity emissions + process emissions for each product, divided by production volume. This is the number that goes into the CBAM declaration. The spreadsheet must show every input and every calculation step, with cell references that trace back to source documents. If you use a third-party tool (e.g., emissions-accounting software), export the full calculation lineage—verifiers will not accept a black-box output.
8. Tag every shipment to an installation and a production batch
Owner: Logistics, ERP administrator.
✅ Done when: Your ERP or shipment-management system includes a field for "CBAM installation ID" and "production batch or date range." When you ship 1,000 tonnes of steel to an EU buyer, you need to declare the emissions per tonne for that specific batch. If your system only tracks shipments at the SKU level ("hot-rolled coil") without batch-level emissions, you cannot verify actual values. You will default to the sectoral average.
9. Identify a CBAM-accredited verifier and request a readiness assessment
Owner: CFO, with procurement support.
✅ Done when: You have a signed engagement letter with a verifier accredited to ISO 17029, and the verifier has reviewed your draft calculation and your evidence inventory. The readiness assessment should produce a gap analysis: which documents are missing, which calculations need revision, which allocation methodologies are non-compliant. Budget 4–6 weeks for the readiness assessment and another 4–6 weeks to close gaps.
10. Simulate the CBAM XML file format and test the upload to the CBAM Transitional Registry
Owner: IT, sustainability analyst.
✅ Done when: You have generated a sample CBAM report in the XML schema published by the European Commission and successfully uploaded it to the registry's test environment. The registry validates file structure, CN codes, emissions factors, and calculation consistency. If the file fails validation, the error messages are cryptic and the support desk is slow. Test early.
11. Pre-build the verifier evidence pack for Q1 2026
Owner: Sustainability analyst, finance.
✅ Done when: A folder exists (digital or physical) that contains every document the verifier will request: utility bills for January–March 2026, production logs, shipment records, the allocation methodology, the emissions calculation, and the CBAM declaration draft. The verifier should be able to reproduce your emissions number from the evidence pack without asking follow-up questions. If they ask for additional documents during the audit, your evidence pack was incomplete.
12. Lock the Q1 2026 CBAM declaration by 31 May 2026
Owner: CFO.
✅ Done when: The verifier has signed the verification report, you have submitted the CBAM declaration to the EU registry, and the registry has accepted it. Under the permanent regime, declarations are due by the end of the month following the quarter. If you miss the deadline or fail verification, the registry applies the default value to 100% of the quarter's shipments. There is no extension process for firms that "almost finished" verification.
13. Calculate the default-value penalty if verification fails
Owner: Finance.
✅ Done when: A spreadsheet exists that shows: (a) total CO₂ you declared, (b) total CO₂ the registry applied (default value × tonnage), (c) the delta in tonnes, (d) the delta in euros at current EU ETS prices. This is your exposure. If the penalty exceeds the cost of fixing the evidence gap, fix the gap. If the penalty is small, you may choose to accept it for one quarter while you build the infrastructure for Q2.
14. Route CBAM costs to the product P&L, not the sustainability budget
Owner: CFO, FP&A.
✅ Done when: CBAM tariffs appear as a line item in the cost of goods sold for every product you ship to the EU, and the finance team can variance-analyse why the tariff increased or decreased quarter-over-quarter. CBAM is not a corporate-sustainability initiative—it is a tariff, and tariffs belong in product economics. If your sustainability team owns the CBAM budget, they do not have the authority to fix the root causes (procurement decisions, production scheduling, capital investment in low-carbon equipment).
15. Model the 2027 CBAM cost under three scenarios: full verification, partial verification, full default
Owner: FP&A, with sustainability and operations input.
✅ Done when: A financial model exists that shows: (a) CBAM cost if you verify 100% of shipments at actual emissions, (b) CBAM cost if you verify 60% and default on 40%, (c) CBAM cost if you default on 100%. The model should also include verification fees and internal labour cost. This is the business case for investing in evidence infrastructure now versus deferring it. For most exporters, the payback period on evidence infrastructure is less than two quarters.
How Emission3 fits
Emission3 is built for non-EU exporters that need to close the default-value gap before 1 January 2026. We start every engagement with a CBAM readiness call, not a software demo. During that call, we map your installations, your shipment volumes, and your current evidence state. We identify which products are at risk of defaulting and what the financial exposure is. Then we scope the evidence-assembly work: which utility bills need to be digitised, which meters need to be tagged, which allocation methodologies need to be documented.
The platform is document-first. You upload electricity invoices, fuel receipts, and production logs, and the system auto-tags them to installations and batches using CNs, meter IDs, and date ranges. Every emissions calculation is deterministic and reproducible—no black-box models, no machine-learning estimates. When you export a CBAM declaration, it includes the full calculation lineage, the source documents, and the verifier evidence pack in a single ZIP file. Verifiers typically close an Emission3 audit in one review cycle because there are no missing documents and no unexplained calculation steps.
We also pre-format the CBAM XML and validate it against the registry schema before you submit. If the file will fail validation, we catch it during internal QA, not after you have uploaded it to the EU registry and triggered a 30-day resubmission clock. For firms that are shipping their first CBAM-covered goods in Q1 2026, we recommend starting the evidence-assembly process in October 2025. That gives you 12 weeks to close gaps before the quarter starts, and another 8 weeks to complete verification before the 31 May filing deadline.
Current clients include steel mills in Turkey and India, aluminium smelters in the UAE, and fertiliser plants in Egypt. Founding-client pricing is anchored to shipment volume and product complexity, not seat count or transaction count. Most engagements start at €15,000–25,000 for the first filing cycle, which includes the readiness call, evidence digitisation, calculation setup, verifier coordination, and registry submission. If your CBAM exposure exceeds €500,000 per year, the ROI is measurable in the first quarter.
Where to start
If you are a CFO or finance leader at a non-EU exporter and you have not yet mapped your default-value exposure, the first step is to calculate it. Take your 2024 shipment volume to the EU, multiply by the sectoral default for your product, multiply by the current EU ETS price (approximately €60/tonne as of Q2 2025), and compare that number to the tariff you would pay if you verified actual emissions. The delta is your exposure. If the exposure exceeds €200,000 per year, you have a business case for building evidence infrastructure now.
The second step is to request a CBAM readiness call with a provider that has filed permanent CBAM declarations for at least five installations. During that call, you should receive: (a) a list of missing documents, (b) a timeline to close gaps, (c) a cost estimate for verification, and (d) a financial model showing the payback period on evidence infrastructure. If the provider cannot deliver all four outputs in the first conversation, they are not ready to support permanent CBAM.
The third step is to route CBAM costs to the product P&L, not the sustainability budget. CBAM is a tariff, and tariffs are managed by finance, procurement, and operations, not by sustainability teams. The firms that will avoid the default-value penalty in 2026 are the firms that treat CBAM as a cost-of-goods-sold line item, not as a reporting obligation.
Book a CBAM readiness call at /book-demo[4]. We start every engagement with a readiness conversation, and we scope the evidence-assembly work before we propose a contract. If your CBAM exposure is below €100,000 per year, we will tell you in the first call—and we will route you to a lighter-weight solution. If your exposure is above €500,000, we will show you the calculation that proves it, and we will build you a timeline to close the gap before 1 January 2026.
References & Sources
External Sources
- [1]CBAM Regulation (EU) 2023/956, Definitions
Official text of the Carbon Border Adjustment Mechanism regulation, including definitions of installation, embedded emissions, and default values.
- [2]CBAM Implementing Regulation, Article 4: Verification requirements
Detailed technical rules for CBAM verification, including accreditation standards for verifiers and documentation requirements for declarants.
- [3]CBAM Regulation (EU) 2023/956, Article 7: Default values
Establishes the methodology for calculating default values based on the average emission intensity of the worst-performing 10% of EU installations.
Related Content
- [4]Book a CBAM readiness call
All customers start with a readiness call: we map suppliers, gaps, and implementation, no anonymous self-serve onboarding.
- [5]Audit-ready exports in Emission3
For auditors and CFOs, shows the evidence lineage artifact: line-item source documents, deterministic calculation, and verifier evidence pack.